Quantcast
Channel: ArcGIS Blog » ArcGIS Pro
Viewing all 169 articles
Browse latest View live

What’s New in the ArcGIS Pro 1.2 SDK

$
0
0

ArcGIS Pro 1.2 is now available, and with it some exciting updates to the Pro SDK for .NET.

Some of the new enhancements include:

  • Additional SDK templates for Visual Studio
  • New samples, snippets, and SDK resources
  • Enhancements in:
  •   Geometry
  •   Geodatabase
  •   Animation
  •   Customizing popups with HTML5 and Javascript
  •   Command line switches for application logging and diagnostics

Plan to take advantage of the many Pro SDK learning opportunities at Dev Summit 2016 where these new features will be showcased.

Also, learn more at the newly updated Pro SDK resource pages below.

ArcGIS Pro SDK Links:


Animation with the ArcGIS Pro 1.2 SDK: The Millennium Force Coaster at Cedar Point

$
0
0

3D GIS animation is an exciting capability of ArcGIS Pro, and now even more so with expanded functionality with the Pro 1.2 SDK for .NET. There is already a rich set of animation features you can leverage directly from the Pro UI, and even more potential to automate the creation of complex animations using the Pro SDK.  There are a broad range of applications, and this post will focus on a great simulated fly-through, or as you’ll see, a “ride-through”.  Anyone who wants to create compelling visualizations, especially in 3D, would find this functionality useful.  For example, the ability to fly around a new proposed high rise in a downtown area to get an idea of how the city skyline will change or flying along the path of a new elevated train through a city center to give people a sense of the impact it may have on the community.

Chris Fox and Nathan Shephard of the Map Exploration team have created an exciting demonstration and video which showcases the new 3D animation functionality available in the Pro 1.2 SDK, showcasing how you can automate the creation of a complex fly-through in 3D using animation.  Previously through the SDK you could navigate the viewer by zooming to a known camera location and you could create a fly-through by zooming to multiple camera positions in succession.  Now, animation at Pro 1.2 makes it easier to author and edit a fly-through by creating smooth interpolated paths between camera positions to create a nice smooth visualization. In addition, you can simulate the movement of features by creating a time or range animation.

Without further ado, take a ride on the Millennium Force Coaster at Cedar Point in the video below, and then we’ll walk through how it was developed.

The video above is made up of two individual animations created with ArcGIS Pro. Making up the animation are keyframes and transitions.  A keyframe defines the state of the view and includes properties like the camera, layer visibility as well as map time and range.  The transitions define the math used to interpolate between the values of the keyframes, essentially how you get from A to B. In the SDK we can automate the creation of these keyframes and transitions to create a very precise and interesting fly-through.

The following two sections will walk through the steps used to create the two perspective animations.

Front Car Rider Perspective

Here are some of the steps used to create the animation shown in the upper left corner of the above video – from the perspective of riding on the roller coaster:

1.  An existing 3D model of the Millennium Force roller coaster at Cedar Point was downloaded from 3D Warehouse.

2.  The model was in KMZ format, so the KML to Layer tool was then used to convert the model to a multipatch feature class so it could be used in ArcGIS Pro.

3.  Next a new Z-aware polyline feature class was created, and the left and right rail of the roller coaster track were sketched using the multipatch feature class. This gave very precise locations along the track that could be used to interpolate the camera positions or the position along the track.  Two track lines were needed rather than just a line down the middle in order to calculate the roll of the camera or the angle of the bank as you go around a curve.  Note: modifying the roll of the camera is something that can only be done in the SDK.

4.  Next, an add-in was created for Pro.  The add-in took the geometry of the two lines and looped through the vertices.  Within the loop it used the left and right point at the current location and the left and right point at the next position along the tracks to calculate the forward, right and up vectors at that point in the track.  These vectors define the rotation of the point which supply the values of the Pitch, Heading, and Roll of the camera. The heading controls the direction we are looking in the view. The pitch controls the angle we look up or down and roll controls the rotation of the bank as we go around a curve. The camera’s XYZ location was calculated from the average of the left and right point. The location of the camera was also offset along the up vector so the camera was positioned above the track, as if you were sitting right in the front roller coaster car.  Here is some sample SDK code to illustrate, further samples follow:

          //Create the camera with an XYZ location offset on the track along the up vector

          var camera = new ArcGIS.Desktop.Mapping.Camera(currentPoint.X + (_meterOffset * vectors[1].X),

            currentPoint.Y + (_meterOffset * vectors[1].Y),

            currentPoint.Z + (_meterOffset * vectors[1].Z),

            0.0, 0.0, currentPoint.SpatialReference, CameraViewpoint.LookFrom);

          //Calculate heading using the forward vector

          var radian = Math.Atan2(vectors[0].X, vectors[0].Y);

          var heading = radian * -180 / Math.PI;

          camera.Heading = heading;

           //Calculate pitch using the forward vector

          var hypotenuse = Math.Sqrt(Math.Pow(vectors[0].X, 2) + Math.Pow(vectors[0].Y, 2));

          radian = Math.Atan2(vectors[0].Z, hypotenuse);

          var pitch = (radian * 180 / Math.PI);

          camera.Pitch = pitch;

           //Calculate roll using the forward and right vectors

          var d0 = new Vector3D(vectors[0].X, vectors[0].Y, 0);

          var u0 = new Vector3D(0, 0, 1);

          var r0 = Vector3D.CrossProduct(u0, d0);

          var roll = Vector3D.AngleBetween(r0, vectors[2]);

          if (vectors[2].Z < 0)

            roll *= -1;

       camera.Roll = roll;

5.  At the start of the animation, a constant speed is used for the initial ride up the launch lift hill, and as soon as the drop begins, the roller coaster accelerates and acceleration due to gravity is used to calculate the approximate speed at each location.  Using the speed at each location, the approximate time in seconds that it would take to get to that point on the track was calculated.

6.  The last step completing the add-in was creation of a keyframe for each camera position at its corresponding time in the animation.

var cameraTrack = animation.Tracks.OfType<CameraTrack>().First();

cameraTrack.CreateKeyframe(camera, TimeSpan.FromSeconds(timeSeconds), AnimationTransition.FixedArc);

7.  Once the keyframes were created in ArcGIS Pro, you can just click play on the Animation tab and go for the ride.  Pro then smoothly moves from keyframe to keyframe in the designated time to create the visualization.  Pro’s export movie option was used to create the first video which you see inset in the video above.

Spectator Perspective

Here are the steps used to create the main animation for the above video, from the spectator perspective of watching the roller coaster cars going along the track:

1.  An existing 3D model of the Millennium Force roller coaster car was downloaded from 3D Warehouse.

2.  Using the Pro SDK, the camera at each frame in the animation was interpolated from the original animation. This would give us the position of the car as well as its rotation at every frame. Because the coaster train has 9 cars this was repeated for each car in the train, so at each frame we would have 9 cameras.

var cameras = new List<Camera>();

var ticksPerFrame = Convert.ToInt64(animation.Duration.Ticks / (animation.NumberOfFrames – 1));

for (int i = 0; i < animation.NumberOfFrames; i++)

{

var time = TimeSpan.FromTicks(i * ticksPerFrame);

if (time > animation.Duration)

time = animation.Duration;

cameras.Add(mapView.Animation.GetCameraAtTime(time));

}

3.  Next for each camera a new 3D point was in an existing feature class. The camera’s XYZ defined the geometry of the point. The rotation properties of the camera: heading, pitch and roll, along with the frame number were stored as attributes of the point.

for (int i = 0; i < cameras.Count; i++)

{

var camera = cameras[i];

var mapPoint = MapPointBuilder.CreateMapPoint(camera.X, camera.Y, camera.Z, camera.SpatialReference);

var currentPoint = GeometryEngine.Project(mapPoint, spatialRef) as MapPoint;

var buffer = fc.CreateRowBuffer();

buffer["Shape"] = mapPoint;

buffer["Value"] = i+1;

buffer["Heading"] = camera.Heading;

buffer["Pitch"] = camera.Pitch;

buffer["Roll"] = camera.Roll;

var row = fc.CreateRow(buffer);

}

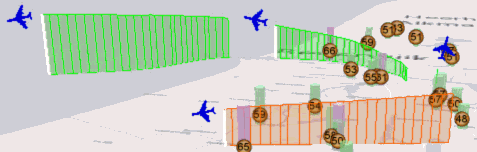
4.  In Pro, the points were then symbolized using the 3D model from step 1 and were rotated using the 3 rotation properties of the camera – heading, pitch and roll.  The point layer was then range enabled using the Value field or the field storing the frame number associated with the point.

5.  New keyframes were then created using the Pro UI to fly around the roller coaster keeping the cars in view as they moved along the track. The keyframes also stored a corresponding range value so that only the car for that given frame would draw.  For example, at frame 1 the range for the map would be equal to 1 and as a result only the cars with a Value attribute 1 would draw. At frame 2 the range was 2 so only the cars with a Value attribute 2 would draw. Because with each frame the cars locations are shifted slightly further along the track we can simulate the movement of the roller coaster cars very similar to a flipbook where on each page a stick figure’s arm is in a slightly different positon. When the individual frames are played in a video it looks like the cars are moving.

6.  Finally, the 2 videos were combined and their playback synced up so you can experience what it is like to ride on the roller coaster as well as watch from above as it goes around the track.

Some Takeaways

  • The ArcGIS Pro 1.2 SDK provides important new functions for building 3D GIS animations.
  • The Pro 1.2 SDK was essential to the entire workflow for building the above complex, realistic animations.
  • It’s possible to capture keyframes in the Pro UI, although the SDK allows for the placement of keyframes at very precise locations in the view, allowing for an accurate and consistent positioning of the camera with smooth perspectives, such as you see in the videos.
  • What’s truly unique about this 3D animation capability in ArcGIS Pro is that it leverages existing GIS data to allow for development of interesting and informative fly-through’s, as well as providing the ability to simulate the movement of actual GIS features in a 3D scene.

Special thanks to Chris Fox for the creation of this demonstration and the content of this post.

Recommended next steps:

ArcGIS Pro SDK Session Update – Dev Summit 2016

$
0
0

Here we go with Dev Summit 2016, and here is the latest listing of the six ArcGIS Pro SDK sessions in chronological order with locations.  For more information, go to the online detailed agenda and type Pro SDK into the search box.   Detailed information and a map inset to the room location are provided.

We look forward to seeing you at these informative sessions, and at the SDK area of the Desktop Island in the Showcase.  Have a great Dev Summit!

ArcGIS Pro SDK for .NET: Programming Patterns

Tue March 8: 4:00 PM – 5:00 PM    Location:  Primrose A (Palm Springs Convention Center)

ArcGIS Pro SDK for .NET: Editing and Geodatabase Integration

Tue March 8: 5:30 PM – 6:30 PM    Location:  Primrose A (Palm Springs Convention Center)

ArcGIS Pro SDK for .NET: Integration with ArcGIS Online

Wed March 9: 10:30 AM – 11:30 AM    Location:  Catalina/Madera (Renaissance Hotel)

ArcGIS Pro SDK for .NET: Solution Based Configuration of ArcGIS (at 1.3)

Wed March 9: 10:30 AM – 11:30 AM    Location:  Mesquite C (Palm Springs Convention Center)

ArcGIS Pro SDK for .NET: UI Design and MVVM

Wed March 9: 4:00 PM – 5:00 PM     Location:  Primrose B (Palm Springs Convention Center)

ArcGIS Pro SDK for .NET: Animation and Map Exploration

Thu March 10: 9:00 AM – 10:00 AM    Location:  Primrose C/D (Palm Springs Convention Center)

ArcGIS Pro in Mac OS X

$
0
0

ArcGIS for Desktop has been developed for Windows Operating systems, but there are many users out there running ArcGIS Desktop on Macs. Two options are available.  The user can install Windows in Boot Camp, a native feature of the Apple Inc.’s OS X operating system, or they can use a virtualization program, such as Parallels or VMWare Fusion.  In order to assess which option to use, it is important to understand each option, their limitations, then to configure for best performance.  The Performance Engineering team has begun testing ArcGIS Desktop, including ArcGIS Pro, on the Apple MacBook Pro in order to develop performance benchmarks and configuration recommendations. In general we have found the UX of ArcGIS Pro in these environments is quite good.  In general, the ArcGIS Pro system requirements should be considered best practices no matter if you are running ArcGIS Pro natively within a Windows environment or using the options available for a Mac:   http://pro.arcgis.com/en/pro-app/get-started/arcgis-pro-system-requirements.htm

Boot Camp

Boot Camp is a utility for Macs that allows users to install and run Windows within a separate bootable partition.  Running Windows in Boot Camp is a native feature of the Mac OS X operating system, therefore this is the most financially affordable option since there is no additional software to be purchased.   However, users may not prefer this option since they are not able to run both OS X and Windows at the same time and a reboot is required to gain access to the Mac software. The Windows partition is configured during the Boot Camp install; this is an important step for optimal performance.  Users should carefully consider how much CPU, Memory and hard disk will be available to the Windows OS, this is of course based upon how many cores and memory is available in the MacBook. The recommended minimum hardware configuration for the windows partition running ArcGIS Pro is:

  • 4 virtual CPU
  • 6 GB of RAM

Parallels with Boot Camp

If Windows has already been installed on a Mac using Boot Camp, users can use Parallels to run the Boot Camp partition as a virtual machine within OS XUsers must purchase the Parallels software to use this virtualization option.  The advantage is that users can run both Windows and Mac applications without rebooting.  This is a suitable option for users whom have newer Macs with more powerful hardware resources in terms of CPU, Memory and an Nvidia graphics card like a GeForce GT 750M.  This is not a recommended option for users whom have older Macs with less than 4GB of RAM since Parallels puts more demand on the Mac’s processors and memory as both operating systems are running at the same time.

In order to gain access to the Windows OS, users work within a Parallels VM.  Configuring this VM is critical for optimal performance.   By default the VM is configured with 2vCPU, 1 GB of RAM and 512 MB of graphics memory.  This configuration is not suitable for a graphically intensive, multi-threaded application like ArcGIS Pro. The minimum hardware configuration for running ArcGIS Pro in Parallels is:

  • 4 virtual CPU
  • 6 GB of RAM
  • 1GB of graphics memory
  • Disable vertical synchronization

The following screenshot describes how the CPU and Memory can be configured within the Boot Camp hardware settings.

The following screenshot describes how the Graphics memory be increased and Vertical Synchronization can be disabled within the Boot Camp hardware settings.

Default optimization settings which should not be changed include “Performance, Faster virtual machine” and Power, Better performance”.

Users who do not have a powerful graphics card have reported flashing in the map display, changing the default display setting from DX11 to DX9 has helped resolved these issues but these users still experience slower rendering times than those with a graphics card present.

VMWare Fusion

VMWare Fusion Pro also provides Mac users with virtualization technology to run Windows and ArcGIS as a virtual machine within OS X.  Users must purchase VMWare fusion to use this virtualization option.  Similar to Parallels, this is a suitable option for users whom have newer Macs with more powerful hardware resources in terms of CPU, Memory and an Nvidia graphics card like a GeForce GT 750M.  VMware Fusion tools is required to be installed within the VM for 3D acceleration. By default, a VMWare Fusion VM is configured with only 1vCPU, 4GB of RAM, and 512 MB of graphics memory.  This configuration is not suitable for a graphically intensive, multi-threaded application like ArcGIS Pro.  The minimum hardware configuration for running ArcGIS Pro in VMWare Fusion is:

  • 4 virtual CPU,
  • 6 GB of RAM
  • 2GB of graphics memory*

*Preliminary testing has shown 2GB of graphic memory required for optimal performance, more than what it required for Parallels.  Esri is continuously working refine the efficiency of the frame buffer and this requirement may change in the future releases.

The following screenshot describes how the CPU and Memory can be configured within VMware Fusion VM settings.

The following screenshot describes how the increase shared graphics memory within the VM display settings.

Default display settings which should not be changed include, accelerate 3D graphics and always use high performance graphics.

In summary, ArcGIS for Desktop can optimally run on Macs, however proper setup and configuration is essential.   Newer Macs which have more powerful hardware resources can optimally support a graphically-intensive program like ArcGIS Pro.   A final configuration recommendation is within the Mac OS X setting, where high performance graphics does not perform graphics switching when running on battery power.  When this setting is enabled, ArcGIS Pro rendering times are more stable.

New ArcGIS Pro SDK Learning Resources Available

$
0
0

Some good news on Pro SDK learning resources – a number of informative videos have just been posted online this week — Dev Summit sessions and a new Live Training Seminar recording.

The 2016 Esri Developer Summit technical sessions are now available on the Esri E380 website, and there are four excellent Pro SDK session recordings available.  These presentations were given by the actual Desktop SDK Team, so you are getting some excellent instruction from the authorities on the Pro SDK.  Here are each of the sessions available online with links and descriptions:

ArcGIS Pro SDK for .NET: Programming Patterns

  • Learn how to write add-ins for ArcGIS Pro. We introduce the ArcGIS Pro SDK for .NET. We cover declarative programming with DAML and the Pro UI Elements. We delve into Pro’s new asynchronous APIs learning how to use async and await and Pro Framework’s QueuedTask.

ArcGIS Pro SDK for .NET: Editing and Geodatabase Integration

  • Learn how to write construction and editing tools in Pro. We customize both the DAML and code-behind to integrate custom construction tools into the Pro Editor and layer Create Feature templates. We introduce edit operations for creating and modifying Geodatabase features.

ArcGIS Pro SDK for .NET: Integration with ArcGIS Online

  • Learn how to write ArcGIS Pro add-ins that take advantage of Pro’s integration with Portal and ArcGIS Online. Use EsriHttpClient and Json.Net to search and retrieve Online items such as map services, feature services, and web maps and add them to your project. We cover item uploading as well.

ArcGIS Pro SDK for .NET: UI Design and MVVM

  • Learn how to write Add-ins for Pro with advanced user interface components. We focus on MVVM and integration of WPF to write compelling UIs with Pro. We also cover multi-threading considerations when developing UIs in Pro.

Also, the recording for last week’s Live Training Seminar on the ArcGIS Pro SDK, “Extend ArcGIS Pro Functionality with Add-ins”, is now available.  The 60-minute LTS provides three short presentations by Rob Burke, of Esri Educational Services. Rob is a long-time veteran of training developers on ArcObjects and ArcGIS Desktop development, and he provides a great introduction to the Pro SDK and asynchronous programming for Pro.

Thanks again to those that attended last week’s LTS and sent in questions.  Answers to your questions have been provided at this GeoNet post.  Keep in mind that you can always check for answers to your Pro SDK questions by searching the post threads on the Pro SDK Group on GeoNet, and post new questions there as well.  You can also review the helpful FAQ page on GitHub.

Navigator for ArcGIS is available on Android in beta!

$
0
0

We are excited to announce the release of Navigator for ArcGIS on Android in beta. This is the first Android release, and it supports optimizing multi-stop routes. Join the beta program to see how the app can benefit your organization.

Optimize multi-stop routes

With this release, Navigator can automatically order stops so that routes are optimized for the shortest or quickest paths. Navigator will do this regardless Navigator on Android now features multi-stop route optimization.of the order a field worker enters or receives stops. This saves you time and money by ensuring that workers always receive the most efficient routes.

Join the beta program

To learn more about this release, join the beta program for Navigator on Android here. You can see how Navigator can increase the efficiency and reliability of your workforce, while providing feedback to the Navigator Team about how we can improve the app.

Look out for Navigator 2.0

The 2.0 release of Navigator on iOS is coming soon. It will support navigating on custom maps with your organization’s assets, road networks, or map displays. We will also be publishing tutorials in Navigator’s help system about how to create these maps in ArcGIS Pro 1.2 or later. Look out for another post in the ArcGIS Blog announcing the release, or check out Navigator’s home page for the latest information about the app.

Virtualizing ArcGIS Pro: Nvidia GRID Telsa M60

$
0
0

The Esri Performance Engineering team has been benchmarking ArcGIS Pro in the virtualized environments using shareable GPU’s for a number of years.  We have published a series of articles in order to assist our users in understanding the technology as well as how to configure the environment for optimal performance.  A consolidated list of resources is listed at the end of this blog for your reference.  Thus far, our testing and list of resources have featured the Nvidia GRID K2 card.  Recently, Nvidia has released a new version of their shareable GPU.   This new offering features the Tesla M6 and M60 cards, as well as the newly released M10.  These new cards are not only more powerful but also they also feature newly enhanced support and license models, as well as monitoring.  For more information please refer to the following data sheet.

The Esri Performance Engineering team began testing the GRID Tesla cards a few months back.  Recent testing has shown that just like the K2, the M60 card can also support the rich graphical experience in ArcGIS Pro.  However, the M60 card has more graphics memory than the K2 (16GB vs 8GB) and more CUDA Cores (4096 vs 3272) for processing ArcGIS Pro rendering requests. Therefore users can expect greater amount of user density per server using the new M60 card.  With these additional resources, the amount of VM’s hosted on a single server is expected to significantly increase with 2 cards inserted.   In our testing, the amount of VM’s increased from 12 to 24 VM’s, using the M60-1Q vGPU (1GB) profile.  Users are advised to test using their own data and workflows for appropriate sizing.  The following table describes the new Tesla M60 card:

It important to note, not all servers which accepted the K2’s can also accept the M60’s.  A list of certified servers can be found here.  The Esri VMware Dell Virtualization appliance, which is on the market today, is an example of an server which will not accept the M60 card.  Therefore we will be releasing new virtualization appliances to the support the M60 in the near future.

The Esri Performance Engineering Team is excited about the latest Nvidia GRID technology.  This technology will help our users successfully virtualize ArcGIS Pro as well as provide the enhanced user experience.  A follow-up blog will be published soon, unveiling our M60 performance test results.  We will also feature this technology hands-on at the UC in San Diego.  Please stop by the Desktop Island within the Expo Hall, where the entire island will feature ArcPro virtualized on the new Virtualization Appliance using Nvidia GRID, Telsa M60.

Lastly, as promised here is a consolidated list of references for Virtualizing ArcGIS Pro using Nvidia GRID K2 technology:

Virtualization of ArcGIS Pro

High Level Look At Virtualizing ArcGIS Pro

Virtualizing ArcGIS Pro:  CPU’s and GPU’s

Virtualizing ArcGIS Pro using Nvidia GRID vGPU Profiles

ArcGIS Desktop Virtualization Appliance

ArcGIS Pro System Requirements

Esri ArcGIS and Nvidia GRID:  An awesome list of blogs to find out more

Map Your Transit Data Like Never Before

$
0
0

Public transit (like buses and subways) serves the people of a city by providing access to jobs, education, shopping, healthcare, recreation, and more. Traffic congestion, climate change, and the evolving economy and population of cities has created a greater need than ever to understand how well transit is serving these needs.

Want to figure out who is underserved by transit, calculate job accessibility in your city, or identify a good place in an urban area to expand your business so it’s easy to get to? How about viewing a map of areas within a short walk of a transit stop?

To answer these questions, you need transit data and good tools to extract the information you need from that data. The ArcGIS for Public Transit group on ArcGIS Online is the place to start!

The General Transit Feed Specification (GTFS) is the only worldwide standard format for public transit stops, routes, and schedules. The advent of the GTFS standard has opened up a world of new possibilities for analysis of and with public transit data in ArcGIS.

A GTFS dataset consists of a set of simple text files containing information about a transit system’s stops, routes, and schedules. Many transit agencies make their GTFS data publicly available. You can obtain a GTFS dataset directly from your transit agency or download it from one of several sites that collects GTFS datasets from around the world, such as Transitland or Transitfeeds.

GTFS data contains geographical information, so you can use it to perform powerful spatial analyses and create useful maps in the ArcGIS platform. Determine your service area and the demographics of your riders, measure access to healthcare or other facilities or services, and find out how transit serves, or doesn’t serve, your store or employees.

To get started, click here to access a set of toolboxes for using GTFS data in ArcGIS. If you don’t see any content, click the “Show ArcGIS Desktop” checkbox on the left. All toolboxes come with step-by-step instructions and troubleshooting advice.

ArcGIS for Public Transit ArcGIS Online group screenshot

ArcGIS for Public Transit ArcGIS Online group screenshot

In a future blog post, we’ll introduce each tool along with some examples of what you can do with it.  So start exploring, and stay tuned!


ArcGIS Pro SDK Development Series, Part 1: Getting Started

$
0
0

We’ve just posted the first in a new series of GeoNet blog posts that will discuss implementation considerations around the ArcGIS Pro SDK.

This first post, found here, will focus on some standard, high-level questions around getting started with ArcGIS Pro and the Pro SDK.  In future posts we’ll explore learning resources for the Pro SDK, planning considerations, migrating customizations from ArcMap, and patterns for add-in design and development.

We’re placing these posts on GeoNet in the ArcGIS Pro SDK Group as it’s the best location for the Pro SDK community to discuss and share ideas.  We hope you’ll consider joining the group, and also begin to explore all the ArcGIS Pro SDK resources available.


ArcGIS Pro SDK Development Series, Part 2: Learning the Pro SDK

$
0
0

The second post in our ArcGIS Pro SDK Development Series is now available here on GeoNet.  The series is discussing common implementation considerations for extending ArcGIS Pro with the SDK.

The new post focuses on the learning resources available for the SDK, along with suggested reading on some of the high-level patterns, and some ideas for building momentum for team learning.

We’re placing these posts on GeoNet in the ArcGIS Pro SDK Group as it’s the best location for the Pro SDK community to discuss and share ideas.  We hope you’ll consider joining the group, and begin to explore all the ArcGIS Pro SDK resources that are available.

ArcGIS Pro SDK at UC 2016

$
0
0

We’re just a week away from the UC 2016 Plenary, and to help you wrap up your schedule, below are some of the best UC week offerings on ArcGIS Pro and the Pro SDK.  Also, don’t forget to swing by the Developer Pavilion in the UC Expo to meet the Desktop SDK Team, ask your questions, and discuss your plans for extending ArcGIS Pro.  Have a great UC!

ArcGIS Pro Sessions:  Check out this handy ArcGIS Pro UC session flyer on GeoNet to find all the key Pro offerings this year.

ArcGIS Pro SDK for .NET:  Add-in Fundamentals and Development Patterns

Tuesday, June 28, 1:30 – 2:45 PM.  Location:  Room 31 A, San Diego Convention Center

Thursday, June 30, 10:15 – 11:30 AM.  Location:  Room 31 A, San Diego Convention Center

Learn about the new Pro SDK for .NET and Add-in extensibilty for Pro, including modules, contracts, DAML, UI customization and skinning. We introduce Pro’s new programming patterns to include async and await, MVVM, Extensions, and coarse grained functions, illustrated with examples from the Pro API.

ArcGIS Pro SDK for .NET:  UI Design and MVVM

Wednesday, June 29, 10:15 – 11:30 AM.  Location:  Room 30 E, San Diego Convention Center

Thursday, June 30, 1:30 – 2:45 PM.  Location:  Room 31 A, San Diego Convention Center

Learn how to write Add-ins for Pro with advanced user interface components. We focus on MVVM and integration of WPF to write compelling UIs with Pro. We also cover multi-threading considerations when developing UIs in Pro.

ArcGIS Pro: Development Team Panel Discussion

Thursday, June 30, 10:15 – 11:30 AM.  Location:  Ballroom 20, San Diego Convention Center

Come meet the senior members of the ArcGIS Pro team and ask about ArcGIS Pro capabilities now and what’s planned for the future.  The team will also be addressing common questions received via Social Media and Esri Support.

For more information see the UC 2016 Detailed Agenda.

New at the UC 2016 Map Gallery: ArcGIS Pro Interactive Map Wall

$
0
0

 ArcGIS Pro Interactive Map Wall

New at this year’s User Conference Map Gallery will be the ArcGIS Pro Interactive Map Wall. The Map Gallery has been a long time feature of the User Conference that is dedicated to showcasing user maps. The new ArcGIS Pro Interactive Map Wall extends the format of the ArcGIS Pro map category from paper to electronic format.

What is ArcGIS Pro Interactive Map Wall?

The Map Wall is a 3×3 grid of monitors, each monitor showing ArcGIS Pro projects authored by users. The user projects use 2D and 3D data. The projects use the ArcGIS Pro Animation functionality that became available in ArcGIS Pro 1.2 to fly-through data, drawing focus and attention to interesting areas and details of the project.

Conference attendees will also be able to use Pro to interact with each user project to look at interesting features, local data and to see how each project is designed and constructed.

The users that submitted their ArcGIS Pro projects for this category also submitted paper maps which will be on display in the Map Gallery.

As with the theme and goal of the Map Gallery, the Map Wall highlights and focuses on real projects created by ArcGIS users. It shows what our users are doing with their data and how they deliver their spatial data, ideas, information and associated content with ArcGIS Pro.


Technology behind Interactive Map WallThe Interactive Map Wall uses the ArcGIS Pro Animation functionality to show user data and projects in a new way. The new electronic format and Animation functionally take full advantage of the incredible capabilities of the ArcGIS Pro rendering engine to provide a fluid, smooth, high-end user experience. These capabilities are available on properly configured physical and virtual desktops.

The 3×3 grid of monitors is powered by virtualization technology driven by Nvidia GRID M60 graphics cards. This is another example of successfully virtualizing the most demanding ArcGIS Pro projects.

Stop by the Map Gallery

The Map Gallery is  in the Sails Pavilion. Stop by during the Map Gallery Opening and Evening Reception, 3:30pm – 7:00pm, Monday, June 27.

Or during normal Map Gallery hours: Tuesday and Wednesday 8:00am – 6:00pm, Thursday 8:00am – 1:30pm

On Tuesday and Wednesday, from 12:00pm to 1:30pm authors will be present to explain how they developed their ArcGIS Pro projects.

If you’re interested in the technology that is used to drive the ArcGIS Pro Interactive Map Wall there will be Esri and Nvidia staff present to explain every detail.

What’s New in the ArcGIS Pro 1.3 SDK

$
0
0

ArcGIS Pro 1.3 is now available, and with it updates to the Pro SDK.  You can install the new Pro SDK update right from within Visual Studio accessing the Visual Studio Gallery (recommended) as seen below, or you can download an install from My Esri.  A helpful guide on SDK installation and upgrade is located here.

Some of the new SDK enhancements include:

  • Editing enhancements
  • New map control
  • Geometry engine enhancements
  • Point IDs
  • Support for shapefiles and query layers
  • New renderers
  • New code samples and guides

A helpful new page in the online Pro API reference provides a list of all of the new API elements in the 1.3 release, and is located in the introduction section here.   Also, as with each release, there are new code samples and SDK guides available from the SDK GitHub sites, included in the links below.

ArcGIS Pro SDK links:

Use your own data with Navigator for ArcGIS 2.0

$
0
0
With the 2.0 release of Navigator, you can see, search for, and get directions to your organization's assets, on your organization's road network.

With the 2.0 release of Navigator,
you can see, search for, and get directions
to your organization’s assets,
on your organization’s road network.

We have released Navigator for ArcGIS 2.0 on the iOS platform! This update includes several anticipated improvements, such as support for navigating with custom maps, optimizing multi-stop routes, writing custom URL schemes that pass addresses, navigating in new languages, and using Portal for ArcGIS 10.4 or later.

Navigate with custom maps

Now field workers can navigate with maps that contain their organization’s assets, private roads, basemaps, or cartography. This means that field workers can search for company assets, see them on customized maps, and get directions to the assets on the road network their company uses. For example, in Navigator, utility workers can now search for, see, and get directions to specific power line supports that need maintenance on their organization’s private roads. This can be done with custom navigation maps created in ArcGIS Pro 1.2 or later. See Navigator’s help for details about how to make and share these maps with your field workers.

Write custom URL schemes that pass addresses

Custom URL schemes allow your users to launch Navigator from your app, website, or email, and navigate based on parameters you’ve provided. They have been supported since before this release, however, until now you could only include latitude and longitude coordinates in the schemes. Now you can write custom URL schemes that include addresses. This gives you more options to send destinations to Navigator. We have also made other changes to the URL scheme structure, which means that you may have to slightly revise your schemes, otherwise they may not work. Check out this documentation on GitHub for details.

Navigate in more languages

Navigator is now available in Arabic, Dutch, Hebrew, and Portuguese (Brazil). For the full list of supported languages, click here.

Navigator for ArcGIS is now available in Hebrew, pictured above, as well as Arabic, Dutch, and Portuguese (Brazil).

Navigator for ArcGIS is now available
in Hebrew, pictured above, as well as
Arabic, Dutch, and Portuguese (Brazil).

Use Portal for ArcGIS 10.4 or later

Navigator has actually been supporting Portal for ArcGIS 10.4 since this released, but since that was relatively recently, we just want to remind you again of this important update.

Test the Android beta

Testing for the beta of Navigator on the Android platform is still occurring. We’ve been getting useful feedback about how to make Navigator work for Android customers. If you are interested in playing with the beta click here.

We are happy to deliver eagerly awaited features in this release. For more details about these updates, check out Navigator’s documentation.

Put the ‘R’ in ArcGIS

$
0
0

Earlier this month at the UC, I presented a demo on the R ArcGIS Bridge that showed how powerful it is when you combine the visualization and spatial analysis power of ArcGIS with the capabilities of R to solve problems. R is a statistical powerhouse programming language that is used all over the world to perform statistical analysis and predictive modeling. The R ArcGIS Bridge offers you the ability to tap directly into R from your current project in ArcGIS to meet your analysis needs as they arise. Through the Bridge, you can seamlessly transfer data back and forth between ArcGIS and R, which allows you the ability to take full advantage of all of the libraries and functions in R as a complement to the spatial analysis and mapping powers of ArcGIS. By harnessing the power of ArcGIS and R, you have access to a wealth of mapping and modeling tools that will allow you to accomplish your tasks at hand, whatever your data, whatever your analysis.

In my demo, I explore crime in San Francisco by quantifying spatial patterns and geoenriching the data using ArcGIS, and then perform some rate smoothing and explore attribute relationships using R. Of course, the demo showcased just one of the countless possible workflows that could benefit from combining ArcGIS and R using the Bridge. You can check out the video here in the new R-ArcGIS GeoNet group: https://geonet.esri.com/videos/3343

I hope it helps to spark ideas on how you can create a thorough analysis with ArcGIS and R to fit your needs and to advance your methods.  For those looking to get started, here is a link to the GitHub site that contains the Bridge: https://github.com/R-ArcGIS/r-bridge-install

Happy Mapping!


Troubleshooting Performance Issues in ArcGIS Pro

$
0
0

ArcGIS Pro is a 64-bit, multi-threaded application that takes advantage of modern computing architecture.  That architecture is a big advantage for ArcGIS Pro, but it does make it a little harder to troubleshoot performance issues when they do occur.  This article will discuss those issues and tools you can use to troubleshoot them.

Since ArcGIS Pro uses your GPU to accelerate rendering, the first thing a user with ArcGIS Pro should do is update their GPU driver directly from the manufacturer (e.g. NVidia or AMD).  New driver releases not only fix bugs and increase stability, but also can give performance increases as well!

The performance problems you may experience in ArcGIS Pro have four main categories:

  1. LOW/INCONSISTENT FRAMERATES: When you observe that the display feels “jerky” or unresponsive to navigation commands, it’s possible that you’re experiencing low or inconsistent framerates.  Usually this is related to the volume of data that’s being loaded or displayed for a given view.

  2. APPLICATION UI IS GREYED OUT: When the commands on the ribbon, context menus, or in your panes are greyed out, this means some part of the application has executed code which must return before the application can receive other inputs.  This greys out portions of the UI.

  3. OPERATIONS ON LAYERS IN YOUR WEB GIS ARE SLOW: When you’re working with Web GIS layers from on-premises/hosted Portal or ArcGIS Online, the map may seem to take a long time to load, or context menu options may seem to be greyed out for a long time.  Usually this is related to network issues (congested or saturated network resources).

  4. A LAYER SEEMS TO REDRAW FREQUENTLY:  When some layers seem to disappear and redraw almost constantly, or after each navigation.  Usually this is a problem with the layer’s caching options – which are available in the layer properties dialog’s “Cache” tab.  Try changing this option to the “Keep cache between sessions” option to resolve the issue, unless the caching option is chosen for a specific reason (e.g. layer is updated regularly).

The developers of ArcGIS Pro have built in some tools to help you troubleshoot performance issues and give a little more info to solve the problem.  Below is more information about these tools, and some possible suggestions to try and work around the problems.  If you’re still having trouble, or you think you’ve found a bug, don’t hesitate to report it to support@esri.com or by calling directly!

Diagnostic Tool: “drawing” indicator

When the graphics system is still loading data or properties to do the work of rendering, there is a “swirling” indicator displayed in the lower right corner of each view.  When this is still moving, it means the graphics system is still accessing data needed to render the view.  If it remains moving for a long time, it can indicate an excessive amount of loading is occurring, or that loading is taking a long time.  This can indicate network congestion or scalability issues if you’re working with Web GIS layers coming from your on—premises, hosted or ArcGIS Online portal.

Drawing Indicator

The drawing indicator shows when loading and drawing is still happening.

Pressing ESC while this indicator is moving should temporarily cancel any remaining loading and make it stop – interacting with the view will begin loading again.

Diagnostic tool: Performance readout/overlay on the view

The graphics system inside of ArcGIS Pro is constantly monitoring the framerate and other stats about the views you’re displaying.  You can get a readout of this information by pressing “Shift-E” with the map view focused.  This will display a line of statistics at the top of the view (see screenshot below for an example)

Diagnostic readout in ArcGIS Pro

The diagnostic readout shows information about the status of rendering as an overlay on top of the view.

This readout is useful for detecting and troubleshooting LOW/INCONSISTENT FRAMERATE issues.

Each segment of this readout gives you information about the rendering system.  Below are descriptions of each segment (color coded for easier understanding) and possible troubleshooting actions you can take based on this readout.

EXAMPLE READOUT:

DX11 High 40.461 (3.103) FPS 266813 Tri/F 10.77M Tri/Sec | MemMb VB 69.00 IB 0291 Tex 565.4 | TrMb VB 9.62 IB 0.004 T1.2 | Tile 99 E 511 C | Unlocked | 1854X954

DX11 = you’re running in DX11 (DirectX 11) mode.  This will say “GL3” when you’re in OpenGL 3.0 mode.

ACTION: If you’re having trouble switch to OpenGL, also upgrade graphics card driver from MANUFACTURER site (not from windows update).

NOTE: If this readout says “WARP” then ArcGIS Pro was unable to detect a GPU that supports the required capabilities, and is using your CPU to emulate a GPU.  This will in general result in poor performance.  Try updating your GPU driver from the manufacturer’s website (NOT from windows update) or switching from DirectX to OpenGL in PROJECT->Options->Display.

High = you’re running in HIGH rendering detail

ACTION:  If your framerate is low in 3D, try LOWERING rendering detail to one of the lower settings in Display Options.

40.461 (3.103) FPS = this is the average (and minimum) FPS for a short period of time.

ACTION: If Average is high but minimum is low, the user is experiencing “stuttering”.  Usually this is a result of trying to load or render data that exceeds the GPU/Memory/CPU resources available.  Try lowering the “out beyond” parameter of distance visibility to something closer, so you’re not trying to load so much.  If overall FPS is low, it could indicate too much geometry in the scene for your graphics card (see the next item).  Again, you can try lowering rendering detail or tightening distance visibility parameters.  You can also try to generalize your geometries – see the “External Tools and related links” section below.

266813 Tri/F=  the number of triangles being displayed per frame.

ACTION: If this goes too high, it will result in poor performance (FPS will be lowered beyond an acceptable amount).  Try lowering distance visibility for layers with lots of geometry, or lowering rendering detail setting.

 10.77M Tri/Sec =  the number of triangles being processed per second.

ACTION: This is a multiple of the framerate times the triangles per frame.  If this goes too high, it will result in poor performance (FPS will be lowered beyond an acceptable amount).  Try lowering distance visibility for layers with lots of geometry, or lowering rendering detail setting.

| MemMb VB 69.00 IB 0291 = these tell you how many Vertex Buffers and Index Buffers are being used.

Tex 565.4 = you are using this amount (in Mb) of texture memory on the graphics card.

ACTION: if the sum of the above two numbers exceeds memory that is installed on the GPU (remember 1024Mb = 1GB) you will begin to seeing stuttering due to swapping of resources to disc/main memory/somewhere.  Lowering Rendering Detail will help with this as it results in down-sampling of textures.  Changing the visibility range for “out beyond” will help too, as you’ll have less texture and geometry in the scene.

TrMb VB 9.62 IB 0.004 T1.2 = This is the amount of information being transferred into/out of Vertex Buffers, Index Buffers, and Texture memory.

Tile 99 E 511 C = you’re using 99 Elevation tiles and 511 “color” tiles.  This is the number of tiles being used to draw the surfaces (elevation + color source like a basemap) in your current view.

ACTION: None needed.  This is informational only.

 Unlocked | 1854X954 = you’re displaying a map view at 1854X954 pixels.

ACTION: None Needed.  This is informational only.

It’s important to note that in ArcGIS Pro 1.3, these numbers are calculated for all views simultaneously, so some will variate quite a bit.   As such, this readout is most useful when only one view is visible.

 Diagnostic Tool: ArcMon

ArcMon is a diagnostic dialog contained in ArcGIS Pro.  To access the ArcMon dialog, press CTRL-Alt-M.  This will open the ArcMon readout as shown below:

Arcmon dialog

The ArcMon dialog gives diagnostic information about different parts of the ArcGIS Pro application

The ArcMon tool has four main areas of diagnostic readout.

Top Section: Performance Trend Graph

Trends GraphWhen one of the line items below the graph are selected, this graph will show that line item graphed over a sampling period of time.  By default it shows a graph of memory usage.  One way to use this is to see trends in (for example) memory usage when a particular tool or workflow is executed in ArcGIS Pro.   As an example, in the graph above, you can see increases in memory usage (circled) when three separate global scenes are opened.

Middle Section: UI Task Log and GUI Hang Log:

Task Log viewThis section logs a list of UI Tasks that resulted from your inputs, and times their execution, resume and wait times.  Any cases where the UI was disabled for an extended period of time is logged in the GUI Hang Log section below.  This can be useful for determining which executed task has resulted in an unexpected UI Hang as in the APPLICATION UI IS GREYED OUT issue listed above – this can then be reported to Esri support.

In the example above, a brief hang is logged for adding Map Notes to the existing map.  Note: All times are listed in milliseconds.  There’s a whole library of research on the topic of response times and responsiveness testing, but as a general rule of thumb, delays of less than 400-500msec can be safely ignored, unless they are consecutive or regularly repeating.

 Bottom section: Activity Indicators for parts of the Application

Activity IndicatorsThe bottom of the ArcMon dialog contains red indicator “lights” to signify when a particular portion of the application is doing work.  This is useful for getting some insight as to what portions of the application are exercised by your workflows, and also for troubleshooting “APPLICATION UI IS GREYED OUT” and “OPERATIONS ON LAYERS IN YOUR WEB GIS ARE SLOW” issues.

These indicators, from left to right, indicate the following functions:

  • “Hung” – when this indicator is red, it means that the application has stopped responding to messages from the operating system.  This is more serious than cases where the application is responding (view is able to navigate, etc.) but buttons are greyed out.  If this lights up for an appreciable amount of time (for instance, more than a half second), then something inside the application has gone wrong.  Please report the actions that led to this indicator to technical support.  You can also float your mouse over the indicator and get a tooltip that gives the cumulative “Hung” time in milliseconds for your entire session.
  • “HTTP” – When this indicator is red, it means the application is requesting content using HTTP requests – for instance, when requesting tiles from a basemap in ArcGIS Online.  If you are experiencing OPERATIONS ON LAYERS IN YOUR WEB GIS ARE SLOW issues, this may indicate network congestion problems, or that your on-premises or hosted portal is overloaded with requests.  Consider using an external tool such as Fiddler (see the “Related Links” section) for this.
  • “Task Busy” – when this indicator is red, it means a UI task is executing.  Some tasks may take longer than others, so this indicator being lit for an excessive amount of time can be OK.  You can also float your mouse over the indicator and get a tooltip that gives the cumulative “Task Busy” time in milliseconds for your entire session.
  • “View Busy” – This indicator is red when a pane is being constructed (for example, when a map view pane is opened).  You can also float your mouse over the indicator and get a tooltip that gives the cumulative “View Busy” time in milliseconds for your entire session.
  • “Dock Busy” – this indicator shows when a dockpane (for example, the symbology pane) is being constructed or destroyed.
  • “Waiting” – This indicator is red when a UI Task is waiting for the Graphics system to release access to a map, layer or project’s properties.  If this indicator remains red for an appreciable time, it can indicate contention between UI tasks and the Graphics system – which can contribute to “APPLICATION UI IS GREYED OUT” issues.  You can also float your mouse over the indicator and get a tooltip that gives the cumulative “Waiting” time in milliseconds for your entire session.
    “Resuming” – This indicator is red when the UI tier is waiting for the Graphics system to resume rendering after a change was made to the map, layer, or project’s properties.

Lastly, the rightmost 4 rectangles indicate when the application or the graphics subsystem are attempting to read properties of the map, layers, or project.  While they are red, some part of the application is retrieving properties of the map, layers, or project in order to do some work.  Note: Depending on how many CPU cores are available on your system, you may see some of these rectangles greyed out.  This is because ArcGIS Pro will not spawn more property-reading threads than cores are available on the system.

External tools and related links 

  1. For the issue OPERATIONS ON LAYERS IN YOUR WEB GIS ARE SLOW, it may be useful to diagnose connectivity and responsiveness of the server or portal involved by investigating requests and responses from the client.   Fiddler is an HTTP proxy and diagnostic tool that can also provide some insight to HTTP requests that take a long time.
  2. When the number of triangles being displayed is very large (as in the LOW/INCONSISTENT FRAMERATES case), the primary recommendation is to lower the distance at which the layer becomes visible.  However, for very dense geometry, sometimes it can help to reduce or simplify the geometries being rendered.  The solution to this can take many forms depending on the source geometries being used:
    1. If your geometries are multipatches, or you’re using a multipatch as a marker symbol, using tools to simplify the geometries can help.

i.      The “3D Workshop Feature Extraction Tools” includes beta tools to repair and even simplify Multipatch geometries:  https://geonet.esri.com/people/GTaylor-esristaff/blog/2016/06/24/3d-workshop-feature-extraction-tools

ii.      The “Local Government Scenes” solution also contains generalization tools for multipatch geometries (the “LOD2” and “LOD3” building tools in http://solutions.arcgis.com/local-government/help/local-government-scenes/ )

    1. If you’re using traditional GIS geometries such as points, lines and polygons, there are generalization tools available that will allow you to reduce the density of geometry that is present in your features.

i.      https://pro.arcgis.com/en/pro-app/tool-reference/cartography/an-overview-of-the-generalization-toolset.htm gives an overview of this toolset.  These tools are installed with ArcGIS Pro and require no additional licensing.

ii.      The Esri Production Line Toolset extension (for ArcGIS Desktop – usable from ArcCatalog) also contains generalization tools: http://www.esri.com/software/arcgis/extensions/production-mapping/key-features

You Asked, We Answered: The Top 10 UC Questions for ArcGIS Pro

$
0
0

Esri User Conference 2016A whole month has passed since the 2016 User Conference. I had the pleasure of meeting so many users, having really great conversations, and answering your questions about ArcGIS Pro. Every user that I met is doing something amazing with ArcGIS Desktop software, so I sincerely thank you for your inspiring work. In addition to sharing stories and attempting to answer your most complex questions, a lot of you had the same questions and concerns about getting started with ArcGIS Pro.

Those of you who weren’t able to attend the conference probably share some of these concerns. So, here are some of the top questions that I was asked at the ArcGIS Desktop pavilion.

1. What is ArcGIS Pro? Is it a new version of ArcMap or Desktop?

ArcGIS Pro is not a new version of ArcMap, it is a different application entirely. Both ArcMap and ArcGIS Pro are applications that are included in ArcGIS Desktop. ArcGIS Pro is a 64-bit, multi-threaded desktop application, with the newest tools for creating and working with spatial data in 2D and 3D.

ArcGIS Pro and ArcMap

Two applications included in ArcGIS Desktop – ArcGIS Pro and ArcMap.

2. Will ArcGIS Pro work on my machine?

If you meet the 1.3 system requirements, yes! Here are some of the basic necessities:

  • Operating system: Windows (64 bit) 7 SP1, 8, 8.1, 10, or Windows Server 2012 RS Standard and Datacenter (64 bit)
  • Microsoft .NET Framework: 4.6.1
  • CPU speed: Quad core (recommended), 2x Hyper-threaded hexa core (optimal)
  • Memory/RAM: 8 GB (recommended), 16 GB (optimal)
  • Disk space: 6 GB or higher
  • Screen resolution: 1024×768 or higher at normal size (96 dpi)
  • Video/Graphics adapter: DirectX 11 (OpenGL 3.2) compatible card with 2 GB RAM (recommended); DirectX 11 (OpenGL 4.4) compatible card with 4 GB RAM (optimal). Be sure to install the latest driver.
  • Microsoft Internet Explorer 10 or 11

3. Where do I download ArcGIS Pro?

The answer is, it depends on who you are!

  • Existing ArcGIS Pro users—If you already have a previous version of ArcGIS Pro installed, you can upgrade to 1.3 through the software itself (Project tab > About) or download it through My Esri.
  • First-time ArcGIS Pro users who are current on ArcGIS Desktop Maintenance—Download 1.3 through My Esri.
  • Others—Sign up for an ArcGIS trial.

4. Will my licensed extensions work with ArcGIS Pro?

Yes! If you’re current on maintenance for ArcGIS Desktop, your licensed Desktop extensions will work with ArcGIS Pro as well. The following extensions are available for ArcGIS Pro: ArcGIS 3D Analyst, ArcGIS Spatial Analyst, ArcGIS Network Analyst, ArcGIS Workflow Manager, ArcGIS Data Interoperability, and ArcGIS Data Reviewer.

5. Can I use my ArcMap documents (.mxd files) in ArcGIS Pro?

You can import your .mxd’s, which converts them to files compatible with ArcGIS Pro. Here’s a gif to show you how!

Click Import, browse to your .mxd, and click Select!

Just click the Insert tab, click Import Map, and browse to your .mxd. All of your data, tables, and symbology will be imported. If your data source can’t be found, learn how to repair broken data links in ArcGIS Pro.

6. How do I use 3D? Do I have to have the 3D Analyst extension?

ArcGIS Pro is built on a powerful graphics engine and designed to transition easily between 2D and 3D. On the Insert tab, click the New Map drop-down menu and click New Scene. Or click Convert on the View tab to change your 2D map view to a 3D scene.

3D linked views in ArcGIS Pro

A 3D view of New Zealand’s Mt. Cook in ArcGIS Pro.

You don’t need 3D Analyst for authoring, navigating, editing, and sharing 3D scenes. However, the 3D Analyst extension is required for performing advanced 3D analysis.

7. How do I share to ArcGIS Online?

Sharing is just as easy as going 3D! ArcGIS Pro is designed with cloud GIS in mind, so the Share tab is filled with different ways to share your work.

Share tab in ArcGIS Pro

The Share tab in ArcGIS Pro provides the tools you need to share your work.

With ArcGIS Pro 1.3, you can share web tile layers and web elevation layers with vector tile packages and scene layer packages. Of course, you can also share your maps, scenes, geoprocessing tools and workflows, and entire projects within your organization or with everyone on ArcGIS Online.

8. Will my geoprocessing models and Python scripts work in ArcGIS Pro?

Usually, yes.

The majority of geoprocessing tools that are available in ArcMap are also in ArcGIS Pro. However, if a tool in your model is not available in ArcGIS Pro, then the model will not work. You may need to wait until that tool is available in a future release of ArcGIS Pro, or you can remove the tool and find a workaround. If a tool in the model has changed in ArcGIS Pro, then the model will not work until you update the model – to do this, open the model in ArcGIS Pro, validate, and save.

The same type of answer applies to your Python scripts. ArcGIS Pro uses Python 3.4, while other apps in ArcGIS Desktop use Python 2.x. Despite some significant differences between these versions of Python, many scripts can be used as-is in both ArcMap and ArcGIS Pro. Read about Python migration for more details.

You can use the Analyze Tools For Pro geoprocessing tool to analyze your scripts or models for necessary updates to get them working in ArcGIS Pro. A tool’s help page also provides information that you may need to get your models and scripts running.

9. How do I share the work I do in ArcGIS Pro with someone using ArcMap?

ArcMap and ArcGIS Pro can be run side by side, on the same machine, so it is possible to use both applications for accessing and working with local data and online services. Data can be shared between applications through geodatabases, shapefiles, and other supported formats.

Maps can be published as services from ArcGIS Pro and shared with someone using ArcMap, ArcGIS Online, or Portal for ArcGIS, however, you cannot export a map from ArcGIS Pro as an ArcMap document (.mxd).

10. Why should I get ArcGIS Pro?

For me, the most exciting part of user conference is learning about all of the innovations in the field of GIS. You and all of the other users of the ArcGIS Desktop platform are helping shape the direction of our software development. ArcGIS Pro is the expression of where the field of GIS is going – human innovation, smart technology, and a collaborative and constantly evolving development model.

GIS Provides the Framework and Process

GIS provides the framework and process for enabling a smarter world.

I could say you should get ArcGIS Pro because it is the best, the newest, the shiniest, most exciting software that ArcGIS Desktop is offering, but the real reason lies in your work. The tools that you get with ArcGIS Pro will help you to visualize your spatial data, solve your complex questions, and shape the world around you more intelligently than ever before.

ArcGIS Pro turns 1.3 today

$
0
0

See what’s new in today’s release of ArcGIS Pro 1.3, find out how to get the software, and learn how to use it.

What’s new at ArcGIS Pro 1.3

ArcGIS Pro turns 1.3The latest release number is 1.3, but in software development years, ArcGIS Pro is over four years of age, having its official project inception in early 2012. The first release was in January, 2015.

Hundreds of developers, product engineers, and others like me at Esri who have been building ArcGIS Pro over the years are delighted to see it reach the 1.3 milestone. But what many of us truly measure ArcGIS Pro by is how well it helps GIS professionals like you model, analyze, and intelligently shape the world around us.

The 1.3 release delivers several new capabilities to help you with your work. Here are some highlights:

  • KML layers—View KML layers in Pro. If you need to do something else with a KML layer, such as perform an analysis, use KML To Layer, a geoprocessing tool that converts the data into feature classes and the symbology into a layer file.KML layer
  • Geodatabase topology—Create and edit features and then check whether the results break any topological rules—rules defining spatial relationships—which are preconfigured in the geodatabase that contains the new and edited features. If a feature breaks a rule, it is symbolized and recorded as an error. Geodatabase topology ensures quality geographic data is generated. Try it out…Geodatabase topology: Error Inspector
  • Locate features—You’ve added a layer to your map, and the layer contains thousands or millions of features. Now you want to find the feature that has a specific ID value or name. With Locate Features, you can use the search box in the Locate pane to quickly find the right feature. Try it out…Locate features
  • Image Classification Wizard—Let the wizard guide you through the multistage process of converting pixels from remotely sensed imagery, such as aerial photos, into classes. By doing this, you can convert imagery into thematic maps, which can show, for instance, land that is covered by turf, forest, and so on. Image Classification Wizard

A complete list of new capabilities is available in What’s New at ArcGIS Pro 1.3.

Get ArcGIS Pro 1.3

Common setup questions

At Esri’s International User Conference last week, I talked to several GIS professionals who wanted to install ArcGIS Pro but thought they couldn’t, when in fact they could. Unfortunately, this was preventing them from keeping up with the latest GIS technology. Understanding the following facts, however, made them eager to put ArcGIS Pro on their machines.

Purchasing:

  • ArcGIS Pro is included in ArcGIS Desktop Maintenance—it doesn’t cost extra.

Installing:

  • You don’t need ArcMap installed on your machine to install ArcGIS Pro.
  • If ArcMap is installed, ArcGIS Pro will work on the same machine.
  • ArcGIS Pro works next to any ArcMap version (10.2, 10.3, etc.). You don’t need the latest version of ArcMap.

Licensing:

  • The default licensing model is Named User, which means ArcGIS Pro gets its license through your ArcGIS Online account; however, there are other licensing options as well.
  • You can license named users through Portal for ArcGIS instead of ArcGIS Online.
  • You can convert your Named User licenses to Concurrent Use licenses, which means License Manager provides ArcGIS Pro licenses. These licenses are unique to ArcGIS Pro, so ArcGIS Pro will not use your ArcMap (i.e., Desktop) licenses.
  • You can convert your Named User licenses to Single Use licenses, which means the license is a locally stored file that can be used by one machine.

More questions about ArcGIS Pro are available in the ArcGIS Pro FAQ page.

System requirements

If you’re not sure whether ArcGIS Pro 1.3 will work on your machine, see ArcGIS Pro 1.3 system requirements for the complete requirements list. Some of the more commonly referenced requirements are listed below.

  • Operating system: Windows (64 bit) 7 SP1, 8, 8.1, or 10
  • Microsoft .NET Framework: 4.6.1
  • CPU speed: Quad core (recommended), 2x Hyper-threaded hexa core (optimal)
  • Memory/RAM: 8 GB (recommended), 16 GB (optimal)
  • Disk space: 6 GB or higher
  • Screen resolution: 1024×768 or higher at normal size (96 dpi)
  • Video/Graphics adapter: DirectX 11 (OpenGL 3.2) compatible card with 2 GB RAM (recommended);  DirectX 11 (OpenGL 4.4) compatible card with 4 GB RAM (optimal). Be sure to install the latest driver.
  • Microsoft Internet Explorer 10 or 11

Download and install ArcGIS Pro 1.3

If you and your machine are ready for 1.3, here is where to get it:

  • Existing ArcGIS Pro users—If you already have a previous version of ArcGIS Pro installed, you can upgrade to 1.3 through the software itself (Project tab > About) or download it through My Esri.
  • First-time ArcGIS Pro users who are current on ArcGIS Desktop Maintenance—Download 1.3 through My Esri.
  • Others—Sign up for an ArcGIS trial.

Learn to use ArcGIS Pro

If ArcGIS Pro is new to you, try the quick-start tutorials. I recommend Introducing ArcGIS Pro to get familiar with the software and its user interface.  Each tutorial focuses on a primary aspect of ArcGIS Pro, such as creating projects and symbolizing map layers, and states an estimated time to complete it, which varies between 10 and 45 minutes. Many have a one to three minute overview video, which shows the interaction described in the step-by-step instructions. New tutorials will be added in future updates.

Esri’s Learn site provides several lessons that teach how to use ArcGIS Pro through real-world problems. In Get Started with ArcGIS Pro, you build 2D and 3D maps of Venice, Italy and quantify and visualize flood risk.

If you’re familiar with ArcMap, but new to ArcGIS Pro, the For ArcMap Users help topic is for you. It gives a brief introduction to what’s different and points out where some common tools can be found in ArcGIS Pro.

Hands-on experience with Locate Features (ArcGIS Pro 1.3)

$
0
0

Finding a specific feature on a map sometimes feels like searching for a needle in a haystack, especially when working with many features or with features that are dispersed over a large area. However, starting at version 1.3, this task is made easier in ArcGIS Pro with the addition of Locate Features, which lets you use the Locate pane to search for features. The search is performed on attribute values and can span across any number of layers in your maps or scenes.

This blog post will give you a brief hands-on experience with Locate Features by providing data and showing you how to find a feature named Needle in a feature layer named Haystack1.

Here’s a looped animation, which begins after the blank screen, of what that interaction will look like after you configure the Locate pane to search the Haystack1 feature layer:

Animation of locating features

Animation begins after blank screen. Click for larger view.

Set up ArcGIS Pro 1.3

  1. You will use functionality that is available in the latest version of ArcGIS Pro, so you will need to have ArcGIS Pro 1.3 installed on your machine. The post announcing the 1.3 release provides guidance on that. See the Get ArcGIS Pro 1.3 section.
  2. Download the project package that includes data for this hands-on experience.
  3. In the download, double-click LocateFeatures.ppkx to open the project.

Add Haystack1 to the Locate pane

To locate features from a layer in your map, you’ll need to set up the Locate pane to reference the layer.

  1. Open the Locate pane.
    Open the Locate pane
  2. Add the Haystack1 feature layer as a locate provider, and then disable the XY Provider and Esri World Geocoder from the search. This animation shows how to accomplish these three tasks from the Settings tab on the Locate pane:

    Animation of configuring the Locate pane

    Animation begins after blank screen. Click for larger view.

Find a needle in a haystack

  1. In the Search box on the Locate pane, type Needle and press Enter.
    Type Needle in the Locate pane The location of the needle appears on the map. Search results appear on the Locate pane–you can interact with them.
    The needle in the haystack
  2. Test yourself by adding Haystack2 as another locate provider and search for Needle again. You should be able to find two features this time. This demonstrates that Locate Features can search across multiple layers for the spatial data you need.

See the ArcGIS Pro help to learn more about this and other functionality provided through the Locate pane.

Hands-on experience with geodatabase topologies (ArcGIS Pro 1.3)

$
0
0

This blog post will give you a brief hands-on experience with geodatabase topologies in ArcGIS Pro 1.3.

Geodatabase topologies were introduced in ArcGIS Pro with yesterday’s 1.3 release. In general terms, they model spatial relationships and allow you to perform actions based on those relationships.

A common use of a geodatabase topology is to check the quality of feature edits. The topology determines whether features follow predefined topological rules–that is, permitted spatial relationships. If a rule is broken, an error is recorded and flagged. For example, in this post you will check whether each road segment (line feature) has an intersection (point feature) on each of its two endpoints; the topology will flag endpoints that aren’t covered by a point feature. Geodatabase topologies go a step further–they also help you fix these errors.  (The help topic on geodatabase topologies describes other ways topologies can be useful.)

Set up ArcGIS Pro 1.3

  1. This post demonstrates new functionality available in 1.3, so you will need to have ArcGIS Pro 1.3 installed on your machine. The post announcing the 1.3 release provides guidance on that. See the Get ArcGIS Pro 1.3 section. Although you need the Standard or Advanced license level to fully complete geodatabase topology workflows, you can see much of the topology interface–and become familiar with it–by using the Basic license.
  2. Download the project package that includes data for this hands-on experience.
  3. In the download, double-click GeodatabaseTopology.ppkx to open the project.

Create the geodatabase topology

ArcGIS Pro lets you validate topologies and address errors, but it isn’t currently capable of creating topologies—that capability will come in a release sometime after 1.3. For now, you create geodatabase topologies in ArcMap or ArcCatalog.

The GeodatabaseTopology project you downloaded contains a map and a rudimentary dataset of roads that includes three items: a line feature class for representing roads, a point feature class for representing intersections, and a topology for checking whether road and intersection features follow two topological rules:

  • Endpoint must be covered by–requires that an intersection point feature cover road endpoints.
  • Must not overlap–states “one line must not overlap lines from the same layer”. This helps avoid modeling the same stretch of road with two different line features, which could lead to problems, such as double counting of mileage.

Validate the topology and fix errors

This is the part you can do in ArcGIS Pro 1.3.

  1.  Open the Project pane.Open the Project pane: View tab > Project button > Project Pane
  2. Expand the nodes under Folders to see Roads_Topology. This is where the geodatabase topology is stored in the project.
    The source of the geodatabase topology
  3. Open the Contents pane. Open the Contents paneYou can see the topology was already added to the map.The topology in the map's Contents pane
  4. Open Error Inspector. 
    Open Error Inspector
    You will see the Error Inspector: Map pane. “Map” refers to the name of the map view the topology is in.
    Error Inspector pane
  5. Use the inspector to address topological errors based on the two predefined rules, which are: roads can’t overlap and road endpoints must be covered by intersection points. Here is a looped animation, which begins after the blank screen, showing how to validate the topology and fix errors:

    Animation loop of interaction with Error Inspector

    The animation loop begins after the blank screen. Click for a larger view.

  6. To learn more, point the cursor at various tools to see a short description and then experiment with them.
    Another way to inspect and address topology errors is by using the Modify Features pane.
    Opening the Modify Features paneThe topology tools are the last group of tools on the Modify Features pane. They work much like the ones on the Error Inspector pane.Topology tools in Modify Features
  7. Regardless of whether you use Error Inspector or topology tools on the Modify Features pane, you’ll need to save or discard your edits.
    Save or discard editsDiscard them if you want to experiment more with the same errors. If you’re familiar with editing, try creating your own road features and validating the topology as you go.
Viewing all 169 articles
Browse latest View live